
In non-linear courses there is no concept of right-or-wrong or a scoring mechanism. The node graph simply provides a (non-linear) sequence of VR content and questions. Therefore, in non-linear courses, the point of interest is not a total score, but the choices a student made. All these choices become a specific path that traverses through the course as how the student went through the course wearing a VR headset. Every time a student our app on the headset will log data to review such a ‘student session’ on hindsight.
Of course, particularly for instructors, such a student session, that shows the path of choices and what scene elements were clicked on, can be very interesting to review. In our non-linear editor, we provide two ways to review such student sessions with our ‘analytics’: node graph highlighting and the analytics timeline.
Starting the editor in analytics mode
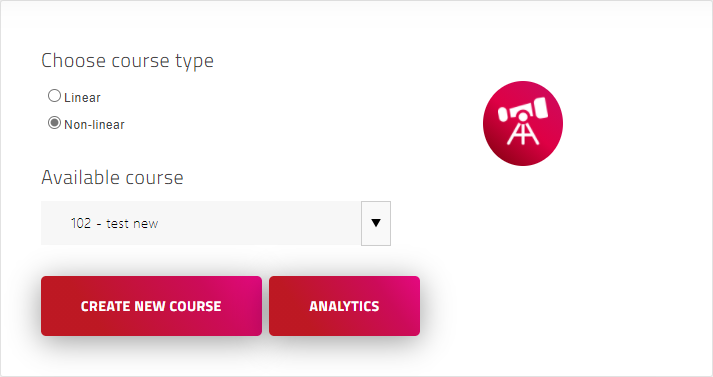
First go to the Courses page and select the course you want to review. Obviously only non-linear courses have this analytics feature so the ‘Analytics’ button only becomes available when the course type is set to non-linear. After selecting a course you can press on this red ‘Analytics’ button to start the editor in analytics mode.
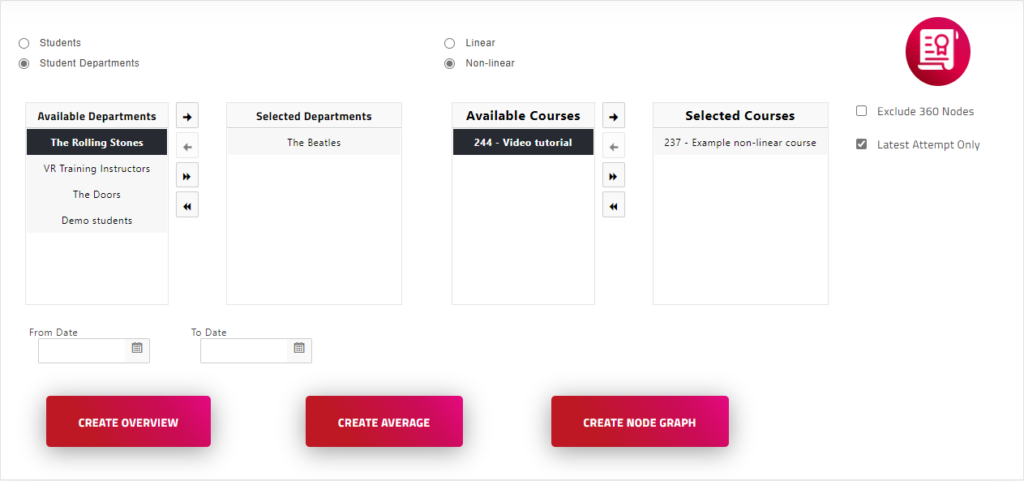
Alternatively you can preselect non-linear courses and students (or student departments) on the Results page and press the ‘Create Node Graph’ button there. This will load the editor in analytics mode with only the preselected data. We recommend this if you have many courses and/or many students for easier and more focused browsing through the available data. Also a nice feature here is the ‘latest attempt only’ option that will only include the most recent student session of the selected student.
Note: the “Create Overview” button on the Results page generates a list of students and the nodes they’ve selected. This is a data representation of basically the same analytics data as seen visually in the node graph. This data can be exported to .XLS or .PDF if necessary.
Viewing analytics
After clicking on the ‘Analytics’ button, the editor will open in the browser and will look quite similar to the editor we’re used to when creating courses with the node graph. However, the editor is in read-only mode, so we cannot edit courses at this stage. In read-only mode we can still see nodes and their scene elements, etc on the node graph. We can even view the pop-up windows we normally use for editing, to see e.g. what scene elements were used. But we cannot make any changes to the course itself.
To review analytics, we’re interested in a student session. A student session is basically ‘one attempt by a student at taking the course’, to say it really simple. There are three dropdowns at the top right to select a student session we want.
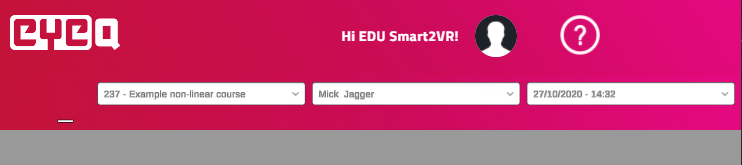
| Courses | List of available non-linear courses (only those with logged sessions) |
| Students | List of students that partook in the selected course (only those with logged sessions) |
| Sessions | List of sessions that the selected student attempted |
If the analytics were loaded after selecting a non-linear course, this non-linear course is already pre-selected in the dropdown and its nodegraph is also loaded. So in this case we do not have to select the course. However, with the courses dropdown list we can select other non-linear courses as well to quickly navigate between courses. Do note that every time a different course is selected, the editor needs to download its course data from the server and then initialize it. So, this may take a little loading time depending on how complex the course is and download speeds.
If you opened analytics via a selected course on the CMS that has no analytics data available, e.g. a new course that no students have tried yet, the editor will prompt that as a message and the first available course that does will be loaded instead.
All dropdowns are searchable for extra productivity to quickly find a course, student or session date. So in the example above, typing ‘mick’ or ‘jag’ in the student drop down list would find our ‘Mick Jagger’ example student and select it.
After selecting a student, the sessions drop down will be updated with all logged sessions of the selected student. These sessions are logged by our app. A session starts when a student starts a course and the sequence of how a student traverses through the course can be visualized in our analytics, either by node graph highlighting or timeline. Also selected scene elements are logged by our analytics. Also note that a session does not have to be completed. If a student stops the course halfway by closing the app or turning the headset off, that first half of the session is still logged.
Another important point to mention about sessions is that they are based on the state of the course when the course was taking. So for example, if the next day, an instructor modifies the course significantly, the logged session (data) is no longer fully representative of the course. E.g. if connection lines are changed, a node is removed, or a new node is put between two existing nodes.
