
To review results, we have to navigate to the ‘Results’ page. It will show a large form to specify what results we want to see.
First of, in the top left corner we can choose whether to pick from the list of all students or pick from the list of student departments. When more and more students are added, grouping them in departments will be helpful to keep the students overview manageable. After a department is selected and results are generated, each individual student of that department will be listed.
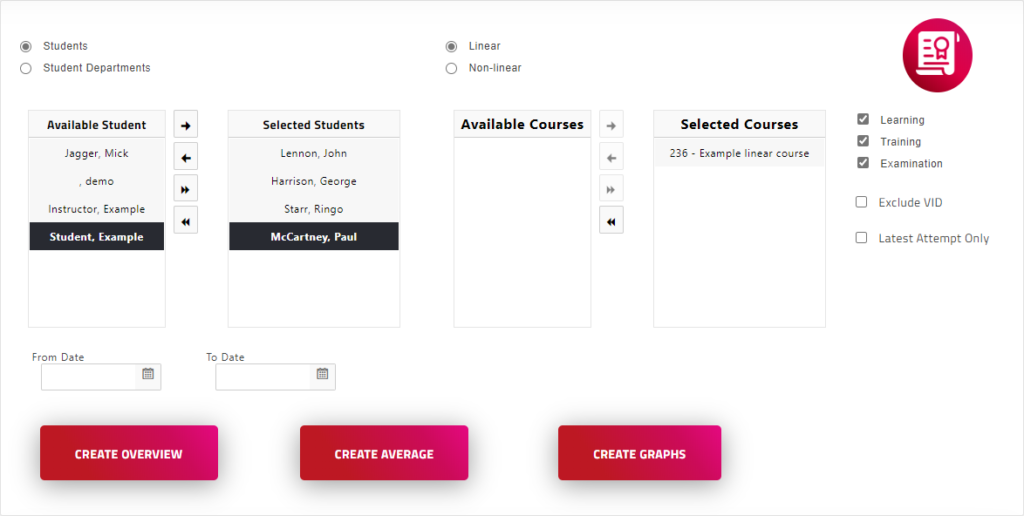
The next option here is to choose between linear and non-linear courses. As this section deals with linear courses, select linear.
Next, there are two list views to select from. First select either the students or student departments we want to see the results from. So select a student from ‘Available students’ in the left side of the list and with the arrow buttons, include it to the ‘Selected students’ on the right side.
Likewise, do the same to select the linear courses we want to see the results from from the ‘Available courses’ and include it in the ‘Selected courses’.
On the right there are some more options to specify. First, we can filter the results on course mode. E.g. when we are only interested in the examination results, we can toggle learning and training off and these will not show in the results.
There is also the option to exclude videos from the results, as they not require activity from the student. Videos have no score, but do have a certain play time duration. When videos are excluded, these durations shall then not be included in the total course duration.
Finally there is the Latest attempt only option. All attempts are stored in the database with a time stamp. So if a student takes a certain course 3 times, it will be logged 3 times in the database. This can be convenient to see how a student is improving. However, when we’re only interested in the latest attempt, we can toggle ‘Latest attempt only’ on and it will filter all previous attempts out of the results.
At the bottom of the form we can also specify a time span. E.g. if we only want to see the results from a certain period, we can specify a start and end date in the from and to date fields.
Next we can generate an overview, average score or graphs.
Overview
In the overview we can see every attempt (or latest attempt, if specified) of a student. We see the student’s name, course date when the student took the course and the name of the course. The next column, the ‘total score’ is where the scores are defined. The First score is the achieved score, i.o.w. the score the student achieved in the course. The pass score is the score we specified while creating the linear course. It is the minimal amount of points required for a student to pass the course. Finally the max points are the max amount of points that can be scored in the course. The sum of all question scores. They are shown in the table as achieved/pass/max … so e.g. 70/55/100 would mean the student scored 70 points out of 100, while the pass score would be 55. A red cross or a green check also appear whether the student has passed.
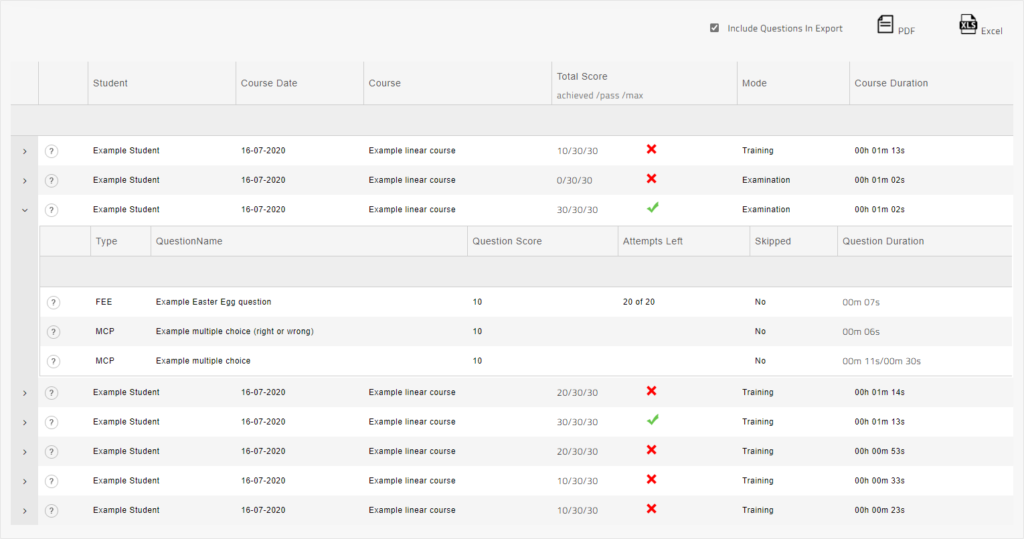
We can also see which course mode the student was using according to how we filtered the course modes in the results.
Finally there is also a course duration column that shows the total time it took the student to complete the course. When videos are excluded, their duration are not included in this duration.
In the results list, we can also expand each result of a student to see details about the course questions. We can see here what the question was, what the student scored on that question, in case of a FEE how many attempts he had left, whether he skipped part of the question (or video) and the time it took the student to answer the question.
Average
Average generates a list with, as the name implies, an average of each selected course (and selected students). It will sho the course name and course mode. The amount of courses taken. The total score, which in this case is the average score. So e.g. if 3 students took a course and scored 10, 20 and 30 respectively, the average will be 20. And the average course duration.
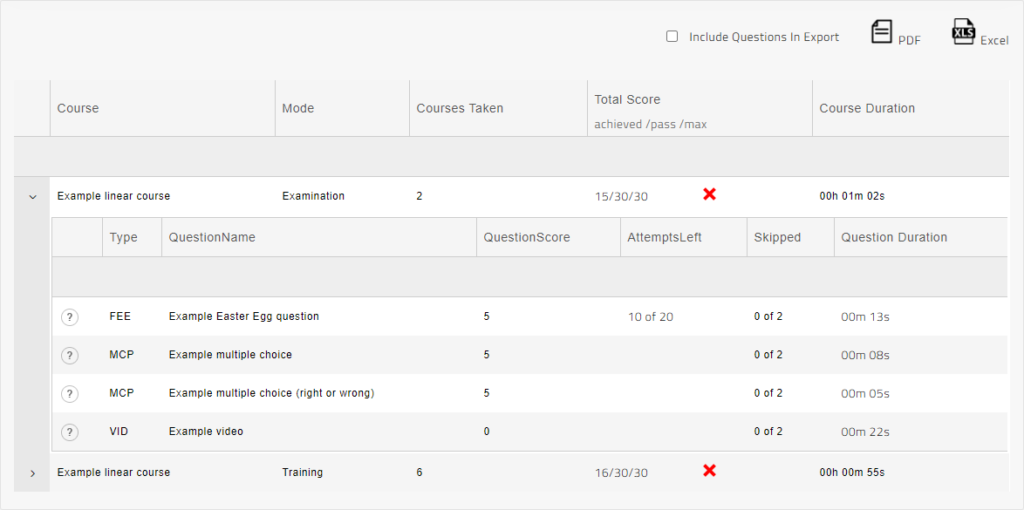
We can expand a course to see the average score, attempts, times skipped and average duration of each course question.
Graphs
The ‘Graphs’ button generates cards with more overviews of interesting statistics and visual representations of course data.
First some general numbers regarding the number of students that made a course (so students that were included in the form to generate the results but did not make any course are excluded from this number!), the number of different courses (again, courses that were included in the form to generate the results but were not taken are excluded) and attempts, as in, total number of courses that were completed by students. Note that these can be multiple attempts by one student if ‘latest attempt only’ is not selected.
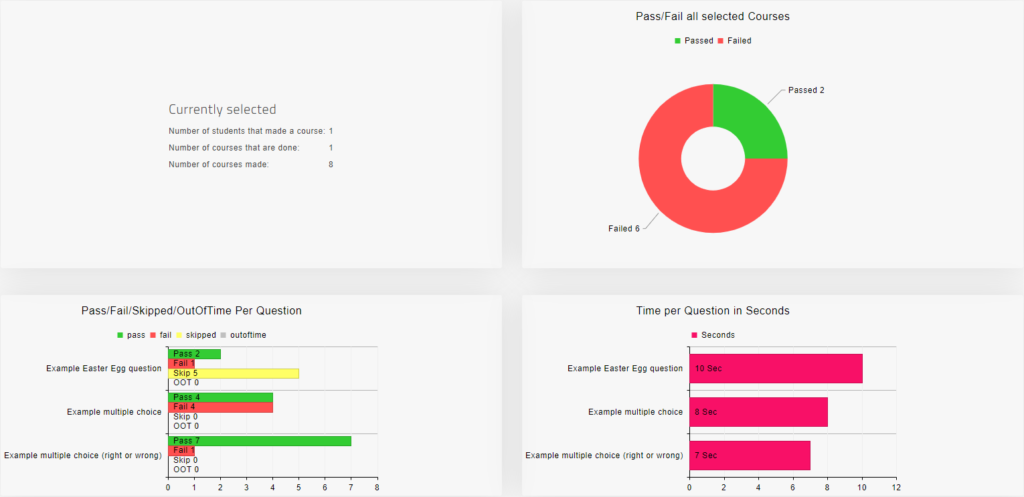
A pie chart that shows the total pass / fail ratio of attempts by students. Note that this can be multiple attempts by one student if ‘latest attempt only’ is not selected.
A more in-depth bar chart that shows the frequencies (of attempts) of pass / fail / skipped and out of time for every question. Out of time depends whether time limits were set in the questions.
Finally a bar chart of the average time per question in seconds that should be self-explanatory.
